
Hungry Buildings
The energy-hungry buildings in the U-S
(source: 2007 Buildings Energy Data Book)
• Buildings now use 72 percent of all electricity and account for 80 percent of all electric expenditures.
• “Internal gains” account for as much as 27 percent of a home’s cooling load.
• There are now 113 million households in the US.
• One-third of all households rent their homes.
• The average new single-family home has increased in size by about 700 square feet since 1980.
• In 2006, 50 percent of all new homes completed were completed in the South. Cooling load management emerges as a priority.
• U.S. buildings carbon dioxide emissions (630 million metric tons of carbon) approximately equal the combined emissions of Japan, France, and the United Kingdom.
• Lighting uses more energy than cooling in the residential sector. This underscores the importance of breakthrough lighting technologies.
• As of 2006, the top five homebuilders hold 20 percent of the total market, the top 20 hold 35 percent, and the top 100 hold 47 percent.
• In 2001, lighting consumed 756 Billion kWh – America’s 104 nuclear generating units produced 769 billion kWh, while operating at a capacity factor of 89 percent. It took our entire nuclear fleet to illuminate America.

Table B.1. Building share of US primary energy consumption (2005)
[Source: 2007 Buildings Energy Data Book]
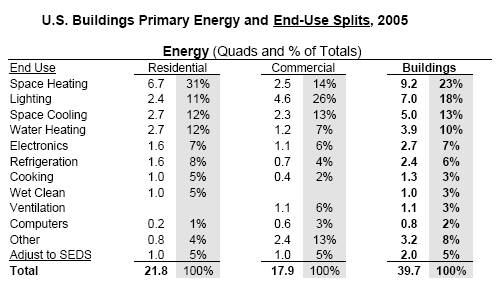
Table B.2. US Building Primary Energy and End-Use Splits, 2005
[Source: 2007 Buildings Energy Data Book]

Table B.3. Carbon Dioxide Emissions for US Buildings
[Source: 2007 Buildings Energy Data Book]

Table B.4. Materials Used in a Construction of a 2,272Sqft Single Family House
[Source: 2007 Buildings Energy Data Book]

Table B.5. Construction Waste.
[Source: 2007 Buildings Energy Data Book]
..
”
Table B.6. Carbon Dioxide Emissions for U.S. Buildings
[Source: 2007 Buildings Energy Data Book]
 ..
..
Table B.7. 2001 Residential Delivered Energy Consumption Intensities by Vintage
[Source: 2007 Buildings Energy Data Book]

Table B.8. 2003 Commercial Primary Energy Consumption Intensities, by Principal Building Type
[Source: 2007 Buildings Energy Data Book]

Table B.9. Electrical Appliance in Residential Sector (Typical Consumption)
[Source: 2007 Buildings Energy Data Book]

Table B.10. World Primary Energy Consumption¹ & Population, by Country/region
[Source: 2007 Buildings Energy Data Book]
1.Total world primary energy consumption in 2004 was about 461.5 Quads [~487EJ.] (Sources: CASF; MSRB)

Leave a comment