Posted by edro on August 8, 2008
World Anthropogenic CO2 Emissions from Fossil Fuel Consumption (including Flaring) Cement Production and Tropical Deforestation
CO2 This Year ( From 1-1-2008 to 8-8-2008 )
23,803.61 MMT CO2
CO2 Total 2007
38,058.66 MMT CO2
Anthropogenic CO2 Total (1750 – Today)
1,358,931.31 MMT CO2
Total atmospheric CO2
3,008,879.36 MMT [3,008.88GT]
How much CO2 are YOU producing?
Each dollar you earn or spend produces 584 g of CO2. [See Carbon Footprint of Your Dollar]
How much CO2 was there before?
Measurements of CO2 levels in Ice cores collected in Antarctica and Greenland indicate that the preindustrial carbon dioxide level was 278 ppm. Between 1000 and 1800 A.D. that level varied by no more than 7 ppm.
What about human activities?
The CO2 levels have now reached 386 ppm, which means human activities have increased the concentration of atmospheric CO2 by 109 ppm or 39 percent.
Notes:
MMT: Million Metric Tons
GT: Gigatons (billion tons)
Sources: CASF/MSRB; CDIAC; Netherlands Environmental Assessment Agency; Earth Systems Research Laboratory; Mauna Loa CO2 monthly mean data.
The following data were used to calculate the total mass of atmospheric CO2 :
1. Mass of dry air: 5.1352 × 10¹⁸ kg
2. The mean molar mass of air: 28.9625 g/mol.
3. Molar mass of CO2: 44.0095 g/mol.
4. Mauna Loa CO2 monthly mean data: 385.60ppmv
[Note: On various websites reporting the carbon dioxide emissions since 1750 the cumulative amount varies from about 1.3 – 1.8 trillion tons. On one website the amount is published once as 1.36 trillion tons and again as 1.71 trillion tons of CO2 on separate pages. Understandably, no sources are quoted. ]
Related Links:
Posted in air pollution, atmosphere, carrying capacity, climate change, collapsing ecosystems, dynamics of collapse, economy, energy, environment, future, lifestyle, ocean acidification, pollution, soil, war | Tagged: Add new tag, carbon dioxide emissions, climate change, CO2, GHG, Human Impact on Nature | 2 Comments »
Posted by edro on April 4, 2008
[Updated]
Index of Human Impact on Nature (HIoN) March 2008
As of End March 2008, the MSRB-CASF Index of Human Impact on Nature (HIoN), an index for calculating the full impact of human consumption and activities on the Earth’s life support systems, stood at a terminally high level of 177.43, a rise of about 3.5 percent over the previous year. In other words, the full human impact including the ecological footprint and the damage inflicted on the living environment by his activities in the 12-month period ending March 2008 was 77.43 percent higher than the load which the planet’s ecosystems in their current state can cope with.
Components of HIoN

The HIoN Index integrates updated data and methodology used by the Millennium Ecosystem Assessment Synthesis Report for Global Status of Provisioning, Regulating, and Cultural Ecosystem services.
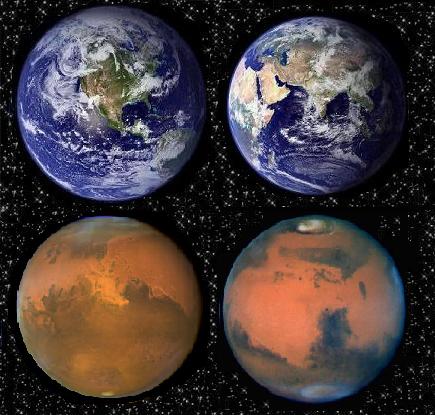
Before and After [Top : Blue Marble composite images generated by NASA. Bottom (left), Mars from Hubble Space Telescope, (right) “Late spring on Mars” portrait taken with the HST Wide Field Planetary Camera-2 by NASA. Final composite image by FEWW.]
According to HIoN projections, our cities and population centers could become almost entirely unsustainable by as early as 2015.
Source: Index of Human Impact on Nature
.
Posted in air, atmosphere, climate change, CO2, economy, energy, environment, future, growth, health, land, lifestyle, natural capital, Oceans, pollution, soil, war, water | Tagged: Blue Marble, Earth, Human Impact on Nature, mars, marsification, Mojavefication, Mojavefied, red tide | 1 Comment »


