
The World Cities Are Running Out of Fresh Water [AND Sinking]
Groundwater from aquifers is a main source for drinking, irrigation and industrial use for much of the world’s population. Globally, an estimated 4 billion people depend on groundwater for drinking, but the water is running out!
Groundwater cannot be replenished from rainfall, and in most cases it takes tens of thousands of years to restore naturally.
According to the International Water Management Institute, about 1,000 cubic kilometers of groundwater are withdrawn each year, which is wholly unsustainable!
Most Precious Resource
Water, our most precious resource, is also the world’s most abused, misused and neglected resource. Water consumption throughout the world is rising mainly due to increasing demands by both industry and irrigation for large volumes of fresh water.
Nearly a third of the world population (2 billion people) have NO access to clean drinking water and just under half of the world population (3 billion) lack proper sanitation facilities. An estimated eighty percent of all illnesses in the developing world are water-related. Up to 4 million people die each year from water-related diarrheal diseases caused by bacterial infections, parasites and viral pathogens.
Hydrologic Cycle
Water cycle, or the hydrologic cycle, is the continuous movement of water on, over, and through the surface of Earth. The ocean water heated by the Sun evaporates into the air, where it is condensed by cooler temperatures into clouds. Moving cloud particles precipitate as rain, snow, hail, sleet and other forms. Most of the precipitation fall in the oceans (about 400,000 km³ of water) and only a fraction on the ground (about 100,000 km³)

About 2.5% of the Earth’s water is freshwater and only about 0.3% of that is available for withdrawal, i.e., stored in aquifers, wetlands, streams, lakes, etc. The rest is locked in glaciers, permanent snow and ice caps…
More Water Facts:
- Total water on Earth: 1.4 x 10^18 m³
- Water in the oceans: About 97.5% of the total
- Volume of Fresh water: Approximately 35 x 10^15 m³ of the earth’s total water. About 0.3% of the freshwater is held in rivers, lakes, and reservoirs and the remainder is stored in glaciers, permanent snow, and groundwater aquifers.
- Water contained in the earth’s atmosphere: about 13 x 10^12 m³
- Water removed from the earth’s surface via evaporation: about 577 x 10^12 m³ each year (only 14% of the water evaporation is from land).
- Total annual precipitation falling on land: about 115 x 10^12 m³ (20% of total evaporation – the 6% surplus water returns to the oceans via rivers.)
- Total freshwater on Earth stored as groundwater: Approximately 11 x 10^15 m³ (30% of all freshwater).
- Water collected in lakes and rivers: about 110 x 10^12 m³ is held as groundwater (one hundredth of the total groundwater reserves)
- Aquifers contribution to human water consumption: an estimated 30% [?] of all of the water used throughout the world.
- Natural recharge rate for the aquifers: from 0.01% to 3% per year.
- Estimated overdraft of global groundwater: about 200 x 10^9 m³ or (twice the average recharge rate!)
What’s the big deal?
Humans are mining groundwater resources, especially the aquifers. Water withdrawal rates from aquifers are drastically higher than their natural recharge rates. In short, we are running out of water!
Sinking Cities
World cities and agricultural lands that are situated above aquifers and groundwater reserves are slowly but permanently sinking into the ground, as the water is pumped out at phenomenal rates.
In China, at least 46 cities are sinking into the ground due to the excessive pumping of groundwater. In Shanghai excessive groundwater pumping contributes to 70 percent of surface subsidence (the remaining 30 percent is thought to be due to the weight of buildings).

Buildings damaged in a cave-in at
Shanghai’s No 4 subway construction site.
[Photo: China Daily] See Fair Use Notice!
Beijing has been sinking into the ground at an annual rate of about 2.5 centimeters (1 inch) in the past 20 years. The area east of Beijing has sunk by more than 70 centimeters (27.5 inches)
In the southern and eastern suburbs of Bangkok, Thailand, about 1,000 square kilometers of land are sinking at a rate of 5-10 cm (2-4 inches) annually.
 USGS scientist, Joe Poland, shows the place of maximum subsidence southwest of Mendota, CA, from 1925 and 1977. Sign reads “San Joaquin Valley California, BM S661, Subsidence 9M, 1925-1977” [Photo credit: Dick Ireland, USGS, 1977]
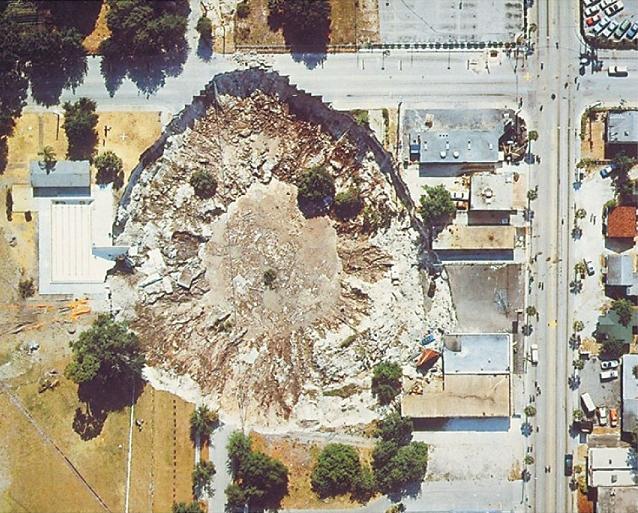
“Collapse sinkholes, such as this one in Winter Park, Florida (1981), may develop abruptly (over a period of hours) and cause catastrophic damage.” Photo credit: USGS
Mexico

The main Cathedral in Mexico City leans to the left after centuries of subsidence.
Water Footprint
Total global water footprint is 7,450 km³ per year (7,450Gm³ per year).
- Water Consumption USA: 2,480m³/per capita/year (agricultural produce 65%; domestic consumption 8%; industrial goods 27%)
- World average: 1,146m³/cap/yr
- China: 700m³
- Developing [poor] world: 545m³
Food production in the U.S. is responsible for 25% of the country’s toxic water pollution and 40% of the common water pollution.

Average national water footprint per capita (m³/capita/yr). Green indicates a national average water footprint of equal to or smaller than global average. Countries marked in red have a larger water footprint than the global average. Source: A. Y. Hoekstra et al. 2005. Water footprints of nations: Water use by people as a function of their consumption pattern.
Bottled Water (2007 estimate)
- Worldwide consumption: 200billion liters (L)
- US share of the market: 35billion L
- US Bottled Water Market: $12.5billion
- US per capita consumption: 115 L (annually)
How Much Energy?
Energy used for production and marketing of a 0.5L, or 500cc (17oz) bottle: 34.58MJ [equivalent to 1.017L of gasoline or 2.35kg of CO2 emissions.]
Notes
1. Above calculation is based on 1,000L of water that is pumped, bottled, delivered, sold and consumed locally, i.e., traveling a total distance of about 130 miles (209km) from source to mouth. The total energy required for production was calculated at 69,162,640kJ, equivalent to 2,034L of gasoline, or 4,699kg of CO2 emissions (Michael Bigelow et al , 2005, THE PIPE OR THE BOTTLE? A Case Study on Energy Consumption, Harvey Mudd College, University of Bradford, UK).
2. According to the above study, the energy requirement for delivering 1,000L of tap water (Yorkshire, England) was about 269,345kJ (about 7.92L of petrol or approximately 18kg of CO2 emissions), making bottled water 257 times more energy intensive than the tap water.
3. Packaging (manufacturing the PET bottles) and shrink-wrapping the bottled water (assumes locally produced water) is responsible for 97.8% of its energy costs.
4. For Bottled water produced internationally add 4.5grams of CO2e equivalent greenhouse gases for each air mile traveled.
5. One liter (L) is 1,000cc, or about 1.057 quarts, 33.827 fluid ounces, or 1/3.785 US gallon.
Virtual Water Content
Table 1. below shows the virtual water content (global average) for selected food and drink. For virtual water content of more products see: Table WVC2.
Table VWC1. Virtual Water Content – Food and Drink

For more products see Table VWC2.

Table VWC2. Virtual Water Content (Global Average – Selected Products). Click on the table to enlarge image.
What to Do
World’s groundwater reserves are running out! Start conserving water before the earth’s water reserves run completely dry!
Change your lifestyle!
References:
– Hoekstra, A. Y. and Chapagain, A. K. 2005. Water footprints of nations: Water use by people as a function of their consumption pattern [online.] Referenced 2008 February 4. URL: http://www.waterfootprint.org/Reports/Hoekstra_and_Chapagain_2006.pdf
– Shiklomanov, I.A. and Rodda, J.C. 2003. World Water Resources at the Beginning of the Twenty-First Century. Cambridge, UK: Cambridge University Press.
– Shiklomanov, I.A. 1993. World fresh water resources. In Water in Crisis: A Guide to the World’s Fresh Water Resources. P. Gleick (ed.). Oxford: Oxford University Press.
– Newson, M. 1994. Hydrology and the River Environment. Clarendon Press. Oxford, England.
– Chapagain, A.K. et al. 2005. The water footprint of cotton consumption. Referenced 2008 February 5. http://www.waterfootprint.org/Reports/Report18.pdf
Related Links:
